11/09/2017 Event
COOL HEADS REQUIRED IN HOT CONSTRUCTION MARKETS

In terms of its overall growth, the Asia-Pacifi c region is leaving the rest of the world in its wake. Yet, on a country-by-country basis, many challenges lie ahead. 18Th of June 2016-Asia-Pacific continues to lead global growth; except in Japan, regional GDP is projected to expand 5.5% in 2016, well above the world average of 2.5%. Growth will accelerate slightly to 5.6% in 2017 and 5.7% in 2018. Yet the headline number conceals variation across economies. New manufacturing hubs, such as Vietnam, are emerging in Southeast Asia and South Asia as China loses cost competitiveness. The information technology-business process outsourcing industry is set for continued rapid growth, not just in India, but also in Malaysia and the Philippines.
Looking ahead, Japan, Malaysia and Vietnam would be major beneficiaries if the Trans-Pacific Partnership is implemented. While a slowing China has led to a lower expectation of construction growth relative to the recent past, Asia-Pacific will continue to be among the healthiest regions, returning to the lead in global construction growth in 2016 with an anticipated 3.6% year-on-year increase. The region will be led by a 5.8% increase in India and a 5.3% increase in infrastructure spending. In Japan, the latest Tanken survey showed softening in business conditions. The unemployment rate is 3.3%, but real wages have declined and are shrinking, ageing population limits growth potential and increases the urgency of reforms in labour and product markets. The problems are compounded by high government debt that may become a serious challenge. Weak wage growth and consumer confidence could further weaken CAPEX through lower corporate profits and a strengthening yen. Higher housing prices due to increased construction costs have weakened residential investment. Australia’s growth remains constrained by an unwinding mining investment boom and weak Chinese demand.
As the pipeline of mining related construction activity dissipates, the lack of significant improvement in other areas of investment implies weak growth. Some support should arise from housing construction, due to the pipeline of construction approvals, although even that pipeline is narrowing as growth in home renovation is slowing sharply, potentially due to policies to rein in investor activity in the housing market. The government’s Asset Recycling Program, where states privatize a number of major physical assets in order to invest in new, targeted infrastructure projects with some federal government assistance, is gaining momentum. Indonesia has slowed steadily, reflecting weakening demand from key markets, particularly China. Policy-related factors – e.g. the raw mineral export ban introduced to drive development of a domestic smelting industry – have further dampened export performance. Given Indonesia’s dependence on China for its exports, the continued deceleration in China is a serious challenge, especially when coupled with sustained low commodity prices and weakness in other emerging Asian economies. The resulting slowdown in private investment could be offset by public infrastructure spending, as funds have been freed by the elimination of fuel subsidies. However, the Indonesian government does not have the financial means to fully compensate for a sustained decline in investment outlays.
The US$ 4.6 billion stimulus announced by the government in September 2015 will ease, but not eliminate, growing pressures on the economy. Malaysia has announced a package of measures to boost capital inflows to support the economy, stabilize the currency, and bolster the stock market. These include a US$ 4.6 billion government capital injection into a government investment vehicle to purchase undervalued Malaysian stocks; requests for Malaysian government-linked corporations to repatriate some of their capital invested abroad to boost capital inflows; measures to support first-home buyers, as well as certain import-duty exemptions for manufacturers. Malaysia is dependent on China’s growth and Southeast Asia’s manufacturing supply chain. Singapore’s economy will struggle to regain momentum. The most promising area is public infrastructure spending, which picked up in late 2015, and should continue growth through 2016 as the government works to expand Changi Airport among other infrastructure projects. To counteract cyclical weakness, Singapore will boost public spending by 7.3% in 2016, an increase of about SGD 5 billion (US$ 3.63 billion). Over SGD 2.5 billion ($ 1.82 billion) of construction spending will be on projects below SGD 100 million ($ 72.7 million) to help smaller construction firms.
Aside from public-sector fi xed-investment expenditures, the construction story remains constrained by limited demand for new housing and commercial space in Singapore. Thailand’s growth will be supported by government spending, but still face headwinds. Recent data shows that Southeast Asia’s second largest economy is still struggling nearly two years after the military seized power to end months of political unrest. While the coup restored political stability, the Thai economy has yet to regain traction; its main growth drivers, exports and domestic demand, have remained stubbornly weak. Public spending was the main growth driver as capital expenditure expanded by 44.1%, with the strongest disbursements going into transportation, irrigation, and small-scale investment projects. Recent economic data for Vietnam has been positive, with economic growth accelerating to a seven-year high (6.7%), and foreign direct investment inflows up 17.4% year-on-year to US$ 14.5 billion in 2015. Risks exist, related to subpar performance at state-owned firms, which still dominate large swathes of the economy; bad debts in the banking sector; and inadequate infrastructure.
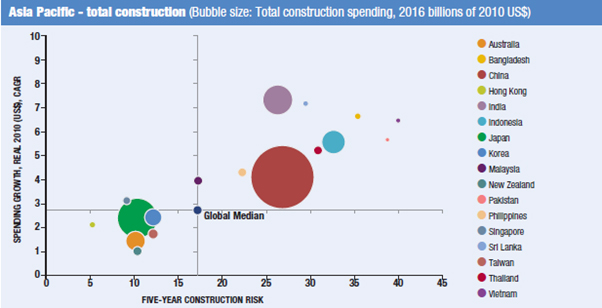
Nevertheless, Vietnam has demonstrated impressive success in scaling up its manufacturing sector and moving into higher value-added industries, such as electronics. The above chart puts these construction markets in the context of the region. The vertical axis represents the five year outlook for compound annual growth. The size of the bubble reflects the 2016 size of the construction market in real U.S. dollars. ,Much of the region falls into the lower left quadrant which features slower growth, but also relatively low risk or the upper right quadrant which features above average growth, but also higher risk. Singapore has the enviable position of offering above average growth with below average risk.

