11/09/2017 Event
OIL DEMAND AND SUPPLY FORECASTS

For the past 20 years, global lubricant demand has closely tracked global GDP growth, but offset by about 3.8 percent. Using the International Monetary Fund’s 5-year GDP forecast should provide a reasonable estimate of future global lubricants growth.Thus, we should expect moderate declines in 2015 and 2016, easing in 2017 and weak expansion thereafter, as economies and GDP struggle to rebound. In other words, more of the same.”
In recent years, lubricant demand has been held back by a weak global economy. Since 2011, succeeding global GDP forecasts have dropped, and the 1.7 percent cumulative reduction for 2015 correlates to about a 600,000 ton loss in lubricant demand and 500,000 ton lower demand for 2016.
Not all regions are experiencing the same rate of growth or decline. Organization for Economic Cooperation and Development countries in Europe and North America will see declines of 1.0 to 1.5 percent per year. “Robust growth is still expected in the emerging economies of Asia, the Middle East and Africa. South America is being held back by the very weak economies of Brazil, Venezuela and Argentina.
By 2020, almost one-half of global lubricant demand will come from Asia Pacific. In contrast, Europe, including Russia, will consume only about one-sixth of total production.

The Supply Scenario
On the supply side, there is some good news and some bad news. About 1.5 million tons per year of capacity has closed over the past two years, and a further 1.1 million t/y will be shuttered in the first half of 2016. A large number of previously announced projects have been postponed to after 2020, if then. Or they have been cancelled altogether. A multitude of issues prompted these decisions.
For example, low crude oil prices have sharply curtailed capital expenditure programs among integrated oil companies. In addition, the large oversupply of base oils shows little sign of abating in the near-tomedium term, affecting some oil companies. Another factor is the sanctions against Russia that have limited access to capital and technology for some companies as Gazprom Neft and Zarubzehneft. Also, U.S. rerefiners have been affected by depressed prices and margins, especially for Group I and II light neutrals.
Finally, low crude oil prices led to reduced access to high-cost, waxy crudes that HollyFrontier had planned for Group III+ base oils production. And there will probably be more cancellations to come.
Over the past 2 years, over 4 million t/y of previously announced capacity additions have been delayed, some indefinitely, or cancelled altogether. Only 800,000 t/y of those may still be possible prior to the end of the decade and another 650,000 t/y of projects to upgrade Group I to Group II and III have been pushed back by a couple of years, possibly longer.
As a result of the delays and cancellation, the latest forecast shows a marked reduction of capacity additions from just two years ago, and the timing and size of the original 2014-15 “tsunami” has abated somewhat. Nevertheless, 17 major capacity additions are still possible by 2020. Five came on-line in 2015, representing 1.1 to 1.2 million t/y. Five more are awaiting start-up or are under construction for streaming during 2016, totaling 2.2 million t/y. Another four may add 800,000 t/y in 2018 or 2019. And three were announced for late in the decade, representing 2.5 million t/y.
Pulling it altogether and adding PAOs, naphthenics, some smaller projects and the retrofit grade shifts, and then throwing in the inevitable capacity creep. We could end up with a further 9.5million t/y of additions by the end of 2020, against a backdrop of little or no increase in demand. That’s the bad news.
This year will be another big year, with 2.7 million t/y of additions. There will be a respite in 2017, and another surge is possible in 2018. Additions will be predominantly Group II in Asia and Europe for use in higher tier formulations and to supplant supply lost from Group I closures.
Today, the surplus is about 5 million t/y, and the loss has been limited only by five recent closures and an industry plant utilization of about 70 to 75 percent. By the end of the decade, the surplus could grow by more than 6 million t/y, necessitating further closures.
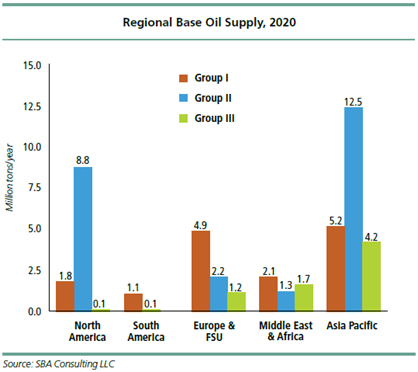
Finally, some Group I plants are already operating near their lower continuous limits. The migration away from Group I continues, with Group II rapidly becoming the workhorse quality. Reviewing the regional production profiles likely in 2020 that Asia will become the largest producer of all three paraffinic qualities. Group II will more heavily dominate the North American and Asian regions, and South America will continue to be constrained to Group I.
All regions will experience declines in Group I supply, he related, but they will be most pronounced in Europe. But Europe and the Middle East should see their first major production of Group II. Project delays and cancellations will keep South America as a large, growing importer of Group II. North America and Asia will continue to be the Group II supply sources to the other regions.
Only relatively minor increases are expected in existing production of Group III. The Americas will remain almost wholly reliant on imports of this base stock, primarily from Asia and the Middle East.

